
Nam D. Pham, Ph.D.[1]
ndp | analytics
August 2026
Summary
Conventional accounting measures portray large health insurers such as UnitedHealth Group (UHG) as earning relatively low profit margins because they treat premium dollars that are subsequently paid out in medical claims as revenue. However, these medical claims are pass-through costs, not income retained by the insurer. Because these pass-through costs are neither retained by the health insurer nor reflect added value of the business, excluding these pass-through costs from revenues offers a more meaningful reflection of profit margins. This approach mirrors the treatment of other financial intermediaries, such as brokerage firms, which do not report on the value of their clients’ trades as revenue, only the fees they retain for facilitating transactions.
When these pass-through costs are appropriately excluded from profit calculations, UHG’s profit margins are comparable to the average among the top ten innovative biopharmaceutical manufacturers, at about 33% of gross profits in 2020-2025. This comparison is striking because these ten biopharmaceutical manufacturers collectively reinvested nearly 52% of operating costs (nearly 35% of their gross profits) into research and development (R&D) to discover new treatments despite significant financial risk, while UHG operates a low-risk, high-volume business model in which 93% of operating costs (more than 62% of gross profit) were devoted to selling, general, and administrative (SG&A) expenses to build a giant healthcare conglomerate, with none of its gross profits invested in R&D.
These findings suggest that common comparisons of profit margins can understate the profitability of health insurers relative to biopharmaceutical manufacturers by failing to account for the large volume of pass-through cost items embedded in insurer revenue.
Background
Recent reports and analyses, including UnitedHealth Group’s report, suggest that the U.S. health insurance industry’s profit margin is low due in part to increased pressure on the industry in recent years. In its January 27, 2026 press release, UnitedHealth Group reported $19.0 billion in earnings from operations and a net margin of 2.7% (net earnings attributable to common shareholders / total revenues) for 2025.[2] Industry analysts similarly subsequently highlighted the company’s continued revenue growth but that profitability has declined relative to prior years.[3]
Although standard financial accounting rules require insurers to record health insurance premiums as revenue on their books, this requirement distorts the total revenue line for publicly traded health insurance companies and, consequently, some profitability metrics used to compare health insurers with other manufacturing sectors, such as biopharmaceuticals. As a result, health insurance companies are misled as a low-margin industry when profitability is measured as operating income relative to total revenue, which includes all pass-through cost items such as claims reimbursements for prescription drugs and healthcare service providers. This measure, while a standard accounting metric, obscures the strong financial performance of financial intermediaries such as health insurance companies, whose revenues are mostly pass-through payments between insured individuals and their health service providers. The metric becomes even less meaningful when health insurance companies are compared with manufacturing companies, such as biopharmaceutical innovators, whose revenue largely reflects the value of their products sold.
This intermediary role has expanded in recent years, particularly for UnitedHealth Group, whose pharmacy benefit manager (PBM) Optum Rx has grown into a major driver of company revenue and profit. Optum Rx has extended UHG’s reach from the traditional insurance broker function into adjacent parts of the healthcare supply chain. In these expanded roles, Optum Rx generates income not only through disclosed fees but also through mechanisms such as spread pricing, patient steering to affiliated pharmacy groups, and newly developed PBM “group purchasing organizations”. These sources of profit are often less visible in public financial reporting than the brokerage fees. As such, understanding the profitability of UHG’s business requires accounting for additional revenue streams alongside the core insurance brokerage, as discussed here.
As financial intermediaries, health insurance companies mediate covered healthcare users with healthcare providers, acting as brokers, negotiating payments for care, and collecting fees for these services. Correctly assessing health insurer revenue should include only the fees these entities collect for payment processing and negotiation services, not the value of the healthcare provided by doctors and hospitals to cover individuals through medical cost pass-through payments.
In the same sense, financial brokerage firms do not count the notional value of a client’s security purchase as their own revenue but only count the brokerage fee (or “industry fee”) they might collect for matching buyers and sellers of securities. In fact, the average daily notional value of U.S. equities traded in 2025 exceeded $1 trillion, which is clearly not an accurate reflection of brokerages’ far lower actual revenue. Similarly, the sports betting industry in the U.S. counts only the service fees charged by sportsbook operators as revenue, not the total value of wagers placed by bettors; in 2025, U.S. sports betting revenue totaled almost $17 billion on a total handle of almost $167 billion. These examples demonstrate the measurement distortion that can result from including underlying values in intermediaries’ transactional facilitation revenue.
A more accurate measure for comparing health insurance and biopharmaceutical industry profit margins is operating profit as a percentage of gross profit, which subtracts the cost of goods sold and, more importantly, pass-through medical costs, which distort operating profit as a percentage of revenue. Applying this more appropriate metric to UnitedHealth Group and the top ten biopharmaceutical manufacturers by revenue shows that health insurer profit margins are similar to those of innovative biopharmaceutical manufacturers, at 33%. While profitability is similar, the sources and uses of profits for UHG and biopharmaceutical manufacturers differ significantly. Insurance companies avoid the high financial and scientific risks that innovator companies must factor into their operations. During 2020-25, more than 93% of UHG’s operating expenses (62.4% of gross profit) are selling, general, and administrative (SG&A) expenses, including employee compensation and benefits, agent and broker commissions, and advertising. In contrast, more than half (52%) of biopharmaceutical manufacturers’ operating expenses (34.6% of gross profit) are R&D, while only 45% are SG&A, less than half of UHG’s proportion.
Data
This analysis uses 2020-2025 financial data from the official corporate annual reports of the largest U.S. health insurance company (UnitedHealth Group) and the ten largest U.S. biopharmaceutical manufacturers by revenue in 2025 (Johnson & Johnson, Eli Lilly, Merck & Co, Pfizer, AbbVie, Bristol Myers Squibb, Amgen, Gilead, Vertex, and Regeneron). The combined revenue of the top ten U.S. biopharmaceutical manufacturers accounted for approximately 77% of the U.S. biopharmaceutical industry; UHG’s revenue accounted for approximately 28% of the U.S. health insurance industry.
Financial line items such as revenue, cost of goods sold, and gross profits were estimated from the companies’ annual financial reports. The average for each financial line item was calculated to show the average across the ten biopharmaceutical manufacturers. An annual average was then calculated for each industry over the time period. (Table 1) (see Appendix for more details on the definitions of the financial categories)
Table 1.
Consolidated Financial Statements, 2020-2025 (annual average, $ billion)
| UnitedHealth Group | Average of 10 Biopharmaceutical Companies | |
| (1) Total revenue | $348.1 | $43.3 |
| Insurance premiums | $272.8 | — |
| Products | $42.0 | $43.3 |
| Services | $30.1 | — |
| Investment income | $3.2 | — |
| (2) Medical costs and cost of goods sold | $268.1 | $13.4 |
| Medical costs (pass-through) | $229.5 | — |
| Cost of goods sold (COGS) | $38.6 | $13.4 |
| (3) Gross profit (1) – (2) | $79.9 | $29.9 |
| (4) Operating costs | $53.5 | $20.0 |
| Selling, general, and administrative (SG&A) | $49.9 | $9.1 |
| Research and development (R&D) | — | $10.3 |
| Depreciation and amortization | $3.6 | — |
| Other | — | $0.6 |
| (5) Operating profit (3) – (4) | $26.4 | $9.9 |
| as % of gross profit | 33.0% | 33.0% |
Analysis and Discussion
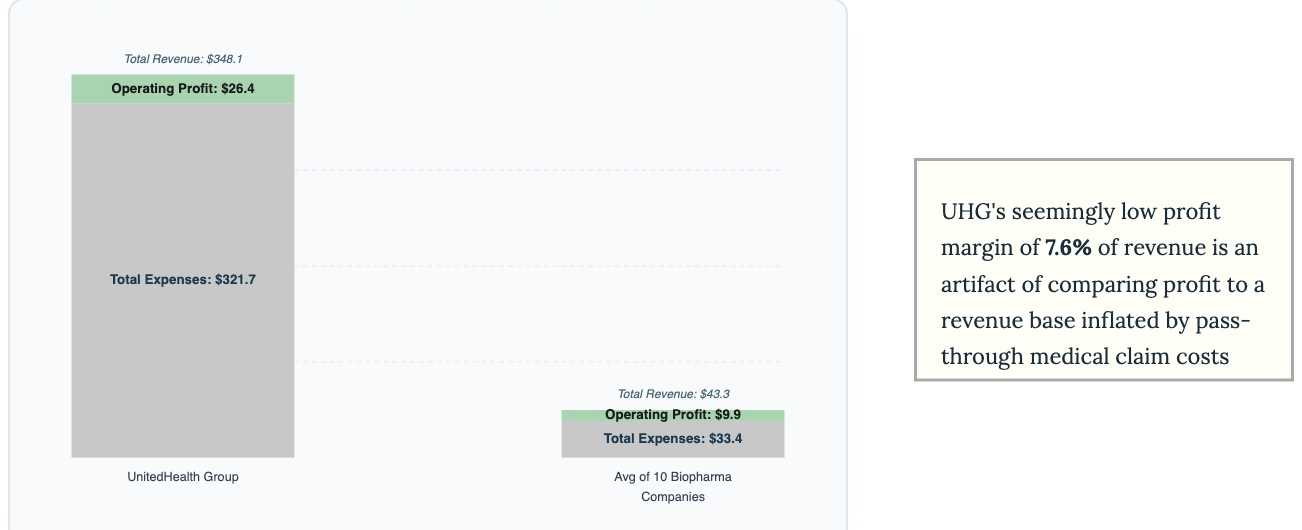
Over the 2020-2025 period, UHG’s total revenue (including insurance premiums, products, services, and investment income) averaged $348.1 billion per year, compared with an average of $43.3 billion for the ten largest U.S. biopharmaceutical manufacturers. Total expenses, including pass-through medical costs, cost of goods sold, and operating costs, averaged $321.7 billion per year for UHG, compared with an average of $33.4 billion for the ten largest U.S. biopharmaceutical manufacturers. (Table 1 above)
The largest category of revenue is medical costs paid on behalf of covered individuals. These are the pass-through costs of insured clients’ premiums paid to healthcare service providers, or the unretained portion of health insurance premiums. The retained portion of premiums represents the fees UHG earns for providing its services and is considered UHG’s revenue, in addition to the other revenue line items listed above. The pass-through medical costs amount to more than 84% of UHG’s insurance premiums collected, in line with Affordable Care Act mandates for large-group market insurers (requiring at least an 85% medical loss ratio (MLR) or a rebate of the difference). As with the financial brokerage and sports betting industry examples mentioned above, where intermediaries recognize only the fees they retain rather than the full value of the underlying transaction, UHG’s medical costs should not be considered part of UHG’s revenue for meaningfully measuring UHG’s profitability.
This distinction is particularly important for vertically integrated healthcare companies such as UHG, which operate across insurance, pharmacy benefit management, pharmacy, provider, and other health services businesses. Because revenues, costs, and profits are generated across multiple affiliated entities, reported results for any single business segment may not fully reflect the enterprise’s overall profitability. This makes it especially important to use profitability measures that distinguish retained earnings from pass-through spending when evaluating companies such as UHG.
Counting the pass-through medical costs (or the unretained premium revenue) in UHG’s total revenue line item explicitly inflates the revenue denominator and understates UHG’s profit margin. UHG’s seemingly single-digit profit margin of 7.6% ($26.4 billion / $348.1 billion) is an artifact of including pass-through medical costs in its total revenue basis. It is more accurate to calculate UHG’s profit by removing these pass-through medical costs to reflect actual financial performance and provide a meaningful comparison to the biopharmaceutical industry. (Figure 1)
Figure 1.
Operating profit and total expenses, 2020-2025 ($ billion)
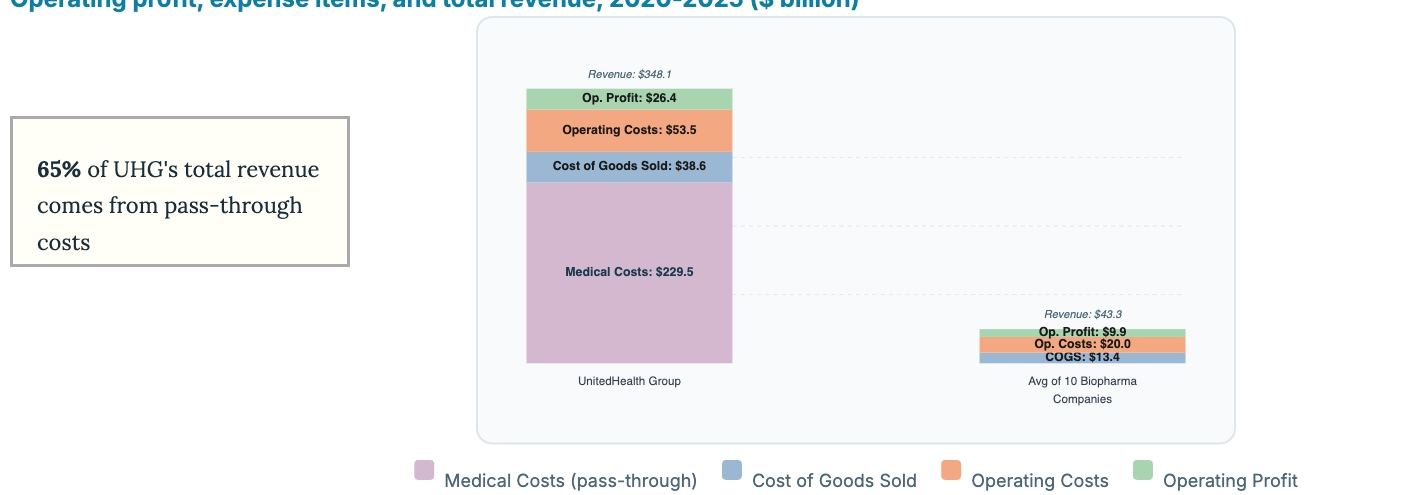
Looking more closely at their expenses, UHG’s cost structure differs fundamentally from the biopharmaceutical industry. UHG’s total expenses during 2020-2025 included $229.5 billion in pass-through medical costs, $38.6 billion in cost of goods sold (COGS), and $53.5 billion in operating costs, while the ten largest U.S. biopharmaceutical manufacturers incurred an average of $13.4 billion in COGS and $20 billion in operating costs, with zero pass-through costs. (Figure 2)
Figure 2.
Operating profit, expense items, and total revenue, 2020-2025 ($ billion)
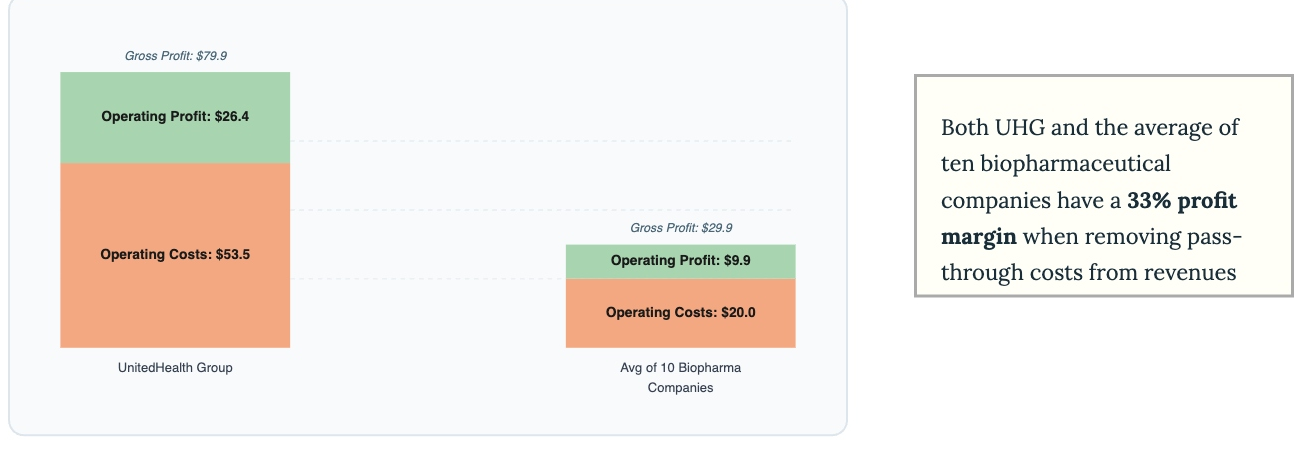
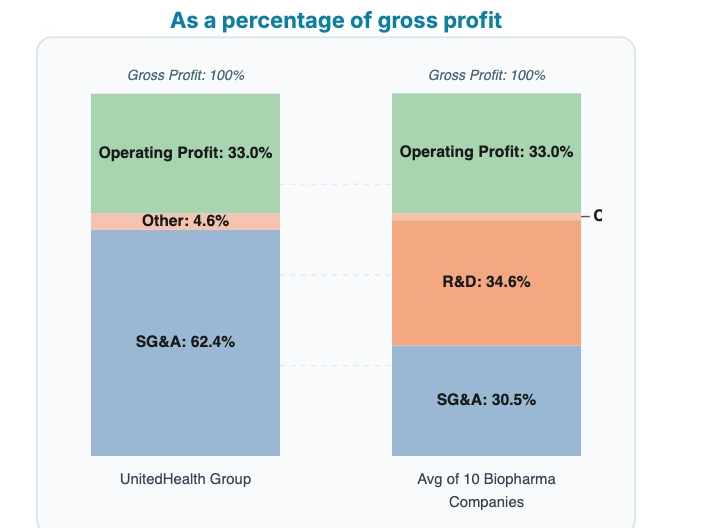
During 2020-2025, UHG’s operating profit averaged 33.0% of gross profit ($26.4 billion / $79.9 billion), comparable to the 33.0% for the ten largest U.S. biopharmaceutical manufacturers ($9.9 billion / $29.9 billion). (Figure 3 and Figure 4)
Figure 3.
Operating profit, operating costs, and gross profit, 2020-2025 ($ billion)
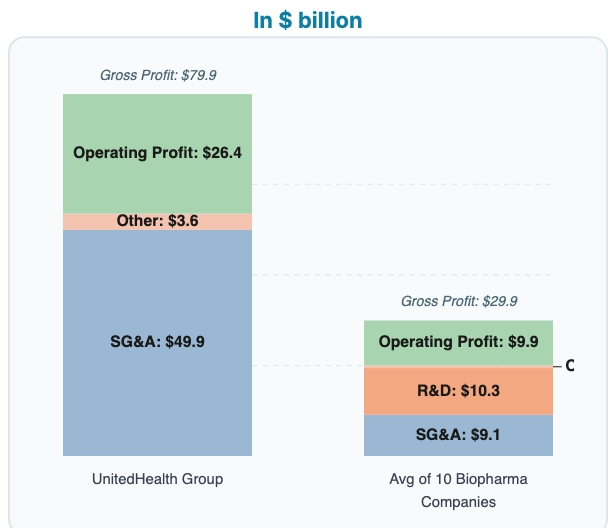
While operating profit as a percentage of gross profit is equivalent for UHG and the average of the ten largest U.S. biopharmaceutical manufacturers, the resources used to generate those profits differ substantially. Indeed, UHG devoted more than 93% of its operating costs ($49.9 billion of $53.5 billion), or 62.4% of gross profits, to SG&A, including employee compensation, broker commissions, marketing, and administrative functions, to build its half-trillion-dollar healthcare conglomerate. In contrast, the ten largest U.S. biopharmaceutical manufacturers devoted about 52% of operating costs, on average, to R&D to discover new therapies to cure and prevent diseases. SG&A for the ten largest U.S. biopharmaceutical manufacturers averaged only 45% of operating costs and less than 35% of gross profits, less than half of UHG’s relative expenditure. (Figure 4)
Figure 4.
Operating profit, expense items, and gross profit, 2020-2025
In $ billion
As a percentage of gross profit
Conclusion
This analysis highlights the fundamental difference between the business models of health insurers and biopharmaceutical manufacturers and underscores the importance of accounting for those differences when evaluating profitability. Health insurers primarily serve as a conduit for healthcare services provided by doctors and hospitals, with most of their reported revenue and expenses representing pass-through medical costs from administering and financing care provided by others.[4] Biopharmaceutical manufacturers, on the other hand, discover, research, develop, and produce the medicines and treatments they provide to the healthcare system.
Because of financial accounting rules, health insurers such as UnitedHealth Group can portray themselves as low-margin enterprises. Their reported revenue includes large volumes of pass-through medical spending that are ultimately paid to providers rather than retained by the insurers. Using a more accurate revenue basis that subtracts pass-through medical costs, UHG’s operating profit margin is equivalent to the average across the top ten biopharmaceutical manufacturers. Although UHG has similar profitability, it allocates its resources to administration and incurs no risky R&D. As a financial intermediary, UHG’s expenses are largely bureaucratic and procedural, such as running utilization management programs or negotiating coverage and payment policies, rather than related to the direct provision of tangible healthcare goods or services. More than 93% of UHG’s operating expenses are SG&A, reflecting spending on marketing, claims processing, administration, and operational activities. In contrast, R&D accounts for nearly 52% of average operating expenses of the ten largest biopharmaceutical manufacturers, underscoring the investment required to discover new medicines.
The results suggest that conventional accounting measures may obscure the extent to which health insurers generate profit margins comparable to those of innovative biopharmaceutical manufacturers, even though health insurers primarily perform administrative and management functions, while manufacturers assume substantial scientific, regulatory, and financial risk.
Appendix
Financial Definitions[5]
| UHG | Biopharmaceutical Companies |
| Revenue by business segment Optum Health: Service revenues include net patient service revenues, financial services offerings, and earns investment income on managed funds. Optum Insight: Service revenues include advisory consulting and managed services to help administer health plans, health systems, and Medicaid programs. Optum Rx: Product revenues include the cost of pharmaceuticals (net of rebates), negotiated dispensing fees, and customer co-payments. Service revenues include administrative services, including claims processing, formulary design, and utilization management and clinical services. UnitedHealthcare: Revenue (and costs) are aggregated for three units within this segment: (i) UnitedHealthcare Employer & Individual, (ii) UnitedHealthcare Medicare & Retirement, and (iii) UnitedHealthcare Community & State. Revenue also includes fees derived from administrative services performed for customers who self-insure the health care costs of their employees and employees’ dependents. | Revenue Net revenue from medicine/treatment product sales. |
| Medical Costs Medical costs, UHG’s main expense, are the aggregate cost of beneficiary claims for medical care reimbursed to health providers. | N/A |
| Cost of Goods Sold Cost of pharmaceuticals dispensed to unaffiliated customers (home delivery, specialty and community pharmacies, network retail pharmacies); and, personnel costs to support services such as transaction processing, system sales, maintenance, and professional services. | Cost of Goods Sold Costs related to the production of products sold, including costs of manufacturing, collaboration/alliance profit shares, collaboration/alliance royalty expense, and inventory-related costs. |
| Gross Profits Gross profits = Revenues – Medical costs – COGS | Gross Profits Gross profits = Revenues – COGS |
| Operating Costs (SG&A)[6] General administrative/operating expenses: The day-to-day SG&A-type non-medical costs of running the health benefits and services businesses, including salaries and benefits for non-medical staff, commissions, technology/platform costs, marketing/sales, and facilities. Additional itemized components include share-based compensation expense, gains and losses on business divestitures, restructuring, and cyberattack responses. | SG&A Administrative overhead day-to-day expenses that are not production or R&D related costs. It includes insurance, utilities, advertising, commercialization costs with collaboration partners, marketing, promotion, accounting, legal expenses, travel, and meals. |
| N/A | R&D All expenses related to research and development. |
| Depreciation & Amortization Depreciation and amortization. | Depreciation & Amortization Biopharmaceutical companies distribute depreciation and amortization across COGS, SG&A, and R&D. |
| Operating Profits Operating profits = Gross profits – Operating costs | Operating Profits Operating profits = Gross profits – SG&A – R&D |
[1] Nam D. Pham, Ph.D. is Managing Partner at ndp | analytics. Insurance Watchdog Coalition provided financial support to conduct this study. The opinions and views expressed in this report are solely those of the author.
[2] UnitedHealth Group Press Release, January 27, 2026. unitedhealthgroup.com
[3] Becker’s Hospital Review, “UnitedHealth’s 2025 profit dips to $12.1B,” January 27, 2026, beckershospitalreview.com; Healthcare Dive, “UnitedHealth revenue climbs in 2025,” January 27, 2026; Medicare Market Insights, “UnitedHealth Group Q3 ’25: Continued Margin Pressure,” October 30, 2025, medicaremarketinsights.com; Oliver Wyman, “Health insurer financial pulse,” Summer 2026, oliverwyman.com.
[4] Being a conglomerate of companies, UHG provides some medical products through its Optum Rx pharmacy subsidiary, with a COGS of about one-fifth of the amount of its pass-through medical costs.
[5] Companies’ various annual reports and standard financial definitions.
[6] UHG does not report SG&A. UHG’s Operating Costs line is essentially SG&A.